
I have been going over my planning for our home education, making a few tweaks and adjustments and one of the things I changed was my sons Maths topic. I know I am going to be doing some Statistics with my daughter in May /June and I was working on some projects on how to make the stats more real-life and I realized that the projects would be perfect for both the kids. But my youngest has not done a lot of stats so in order for the joint projects to work more effectively we are going to do some stats with him beforehand.
I am going to use the same Statistics workbook with my son that I used with my daughter. It worked well the first time and I like the way it progresses, I like the order it introduces the different graphs and activities (just makes sense ) and I found it was easy to link the workbook with extra worksheets from Twinkl when I needed it. It is the Understanding Maths: Statistics
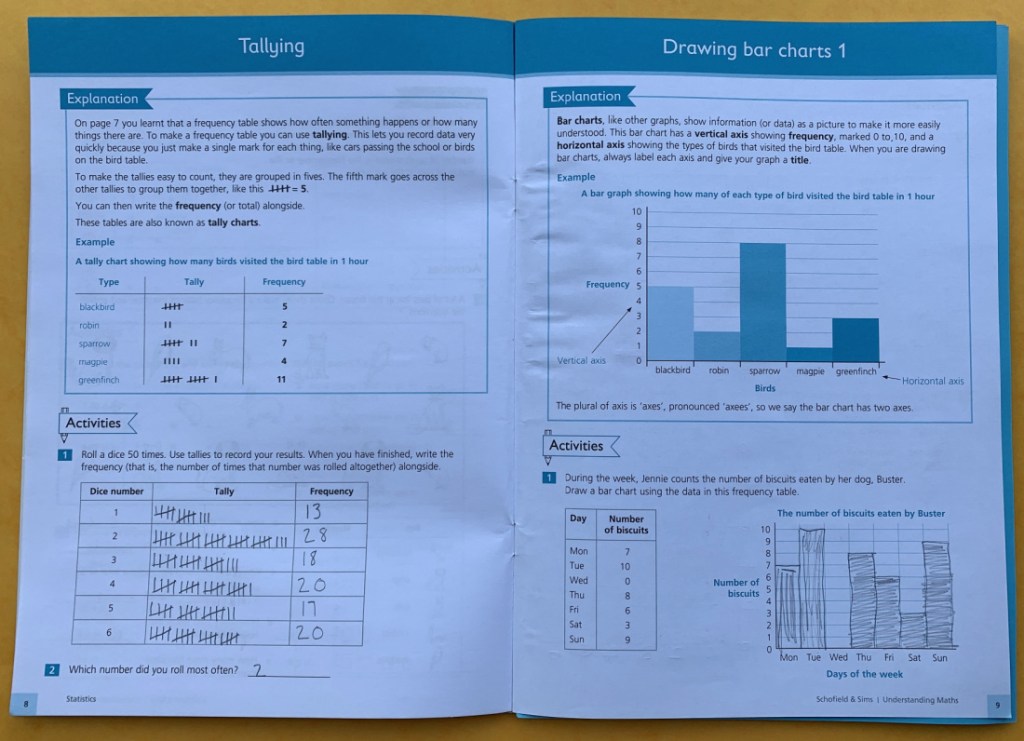
We have used this series a lot with both my kids. The pages always have a concise explanation and then a couple of activities below it. And like I mentioned above they always seem to build up the topic in a way that makes sense i.e. talking about tally marks before bar charts and talking about bar charts before pie charts. It’s just an order that I personally like and it would be the order that I would do it even without the workbook.
The one thing I must stress about these workbooks is there is NOT a lot of practice. It explains an idea gives a few examples and then moves on. So we do tend to add in extra practice where we feel necessary. But I just find these books a good foundation and they make my own preparation time a lot smaller and easier.
So what is covered is the Understanding Maths: Statistics
- Lists
- Pictograms
- Frequency tables
- Tallying
- Drawing bar charts
- Reading and scales
- Venn and Carroll diagrams
- Interpreting bar charts
- Drawing and interpreting line graphs
- Range, mode, median and mode
- Timetables and distance charts
- Conversions
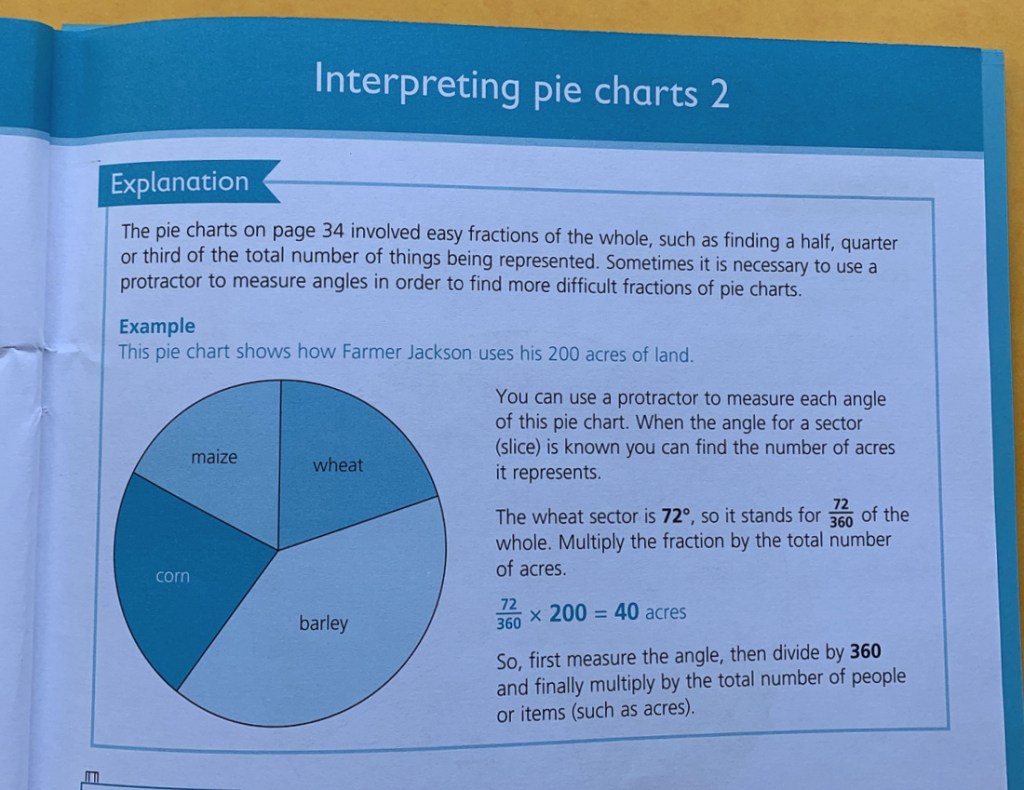
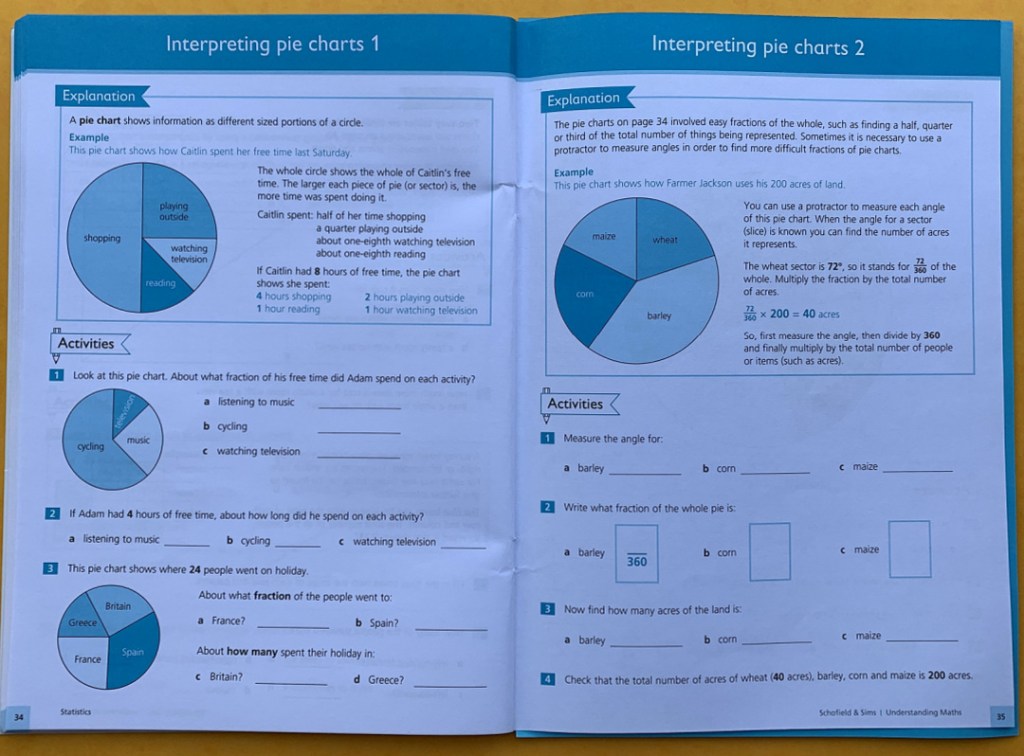
- Interpreting pie charts
- Drawing pie charts
- Misleading stats
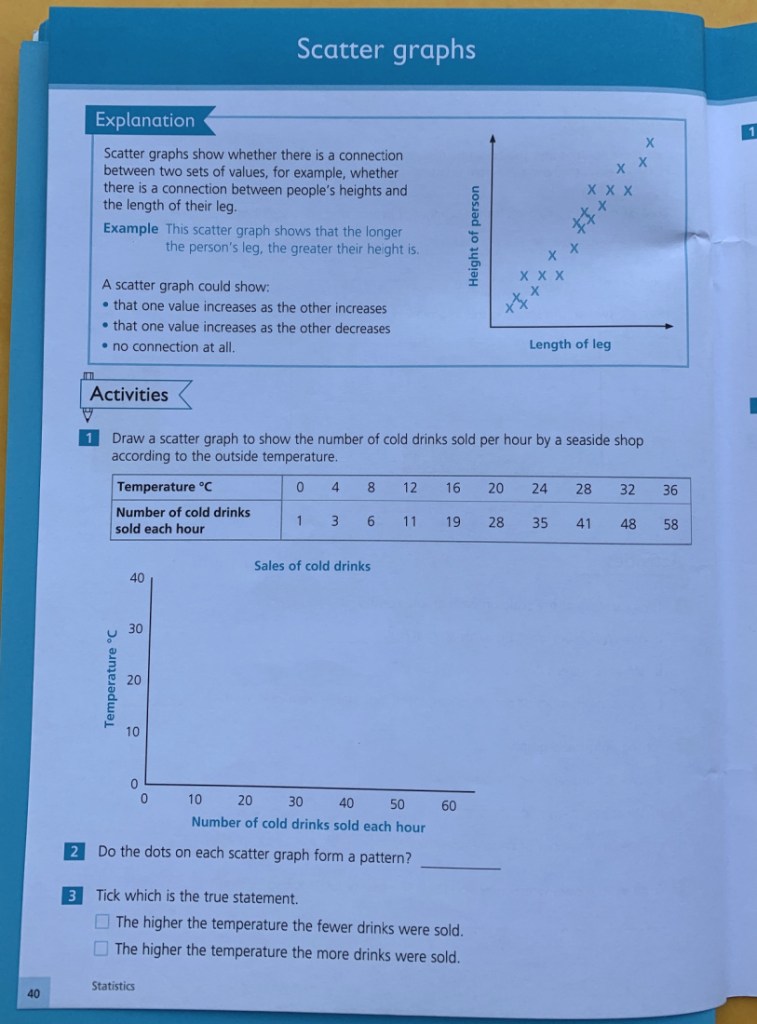
- Scatter graphs
They also include 5 progress tests in the workbook, which really is just a way of practicing what you have learnt so far. And all the answers are in the back of the workbook.

Admin Bit. I bought the Stats workbook that I mention in this post. I have included Affiliate links. If you follow an affiliate link and go on to purchase that product, I will be paid a very small commission, however your cost will remain the same. I only include affiliate links for products that we use and love.

